
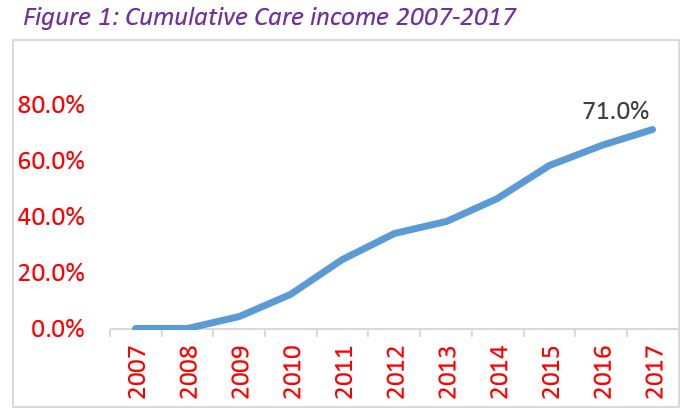
It could be said that from the initiation of the new Aged Care Funding Instrument (ACFI) in March of 2008 that the aged care sector was in a ‘revenue phase’ that saw the cumulative Care Income grow to 71% at March 2017 as shown in Figure 1.
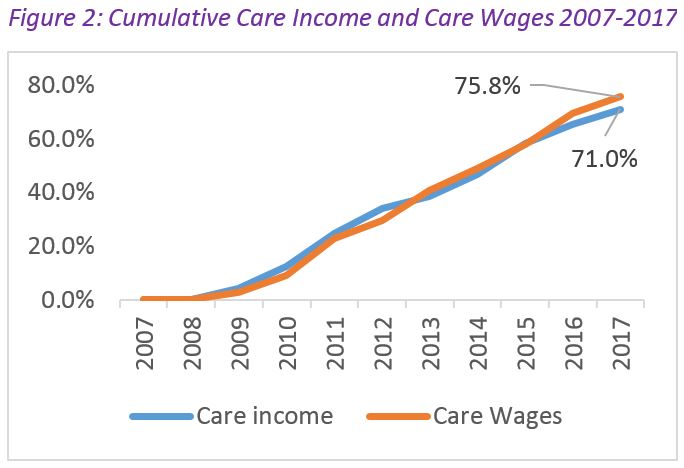
Now there will be a number of people who may see this figure and suggest that providers have done very nicely out of this growth, but while the revenue grew, so did the costs. For example Care Wages grew more than 75% in the same time period.
During this same period the Care Result (care revenue minus care expenses) grew from $4.40 per bed day in June 2007 to a sector high of $14.92 in September of 2011.
Then the first fiscal cliff appeared as the government looked to reign in the growth of their share of care revenue, so that by June 2013 the Care Result had fallen back to $6.79 per bed day.
As this new reality dawned on providers they adjusted and reached a second precipice of September 2015 where $12.56 was the Care Result until another fiscal cliff has resulted in a March 2017 Care Result of $9.93.
As we see ACFI income reduced in real terms we are not seeing the escalation of costs ease in the same manner, presenting a pressing cost management environment providers must now deal with.
The combination of income stagnation and a continued escalation of expenses indicates that cost management is a key focus item for providers and is the key differentiator between the top quartile and the remaining 75% of the sector in the Aged Care Financial Performance Survey. Although all providers saw upward pressure on expenses during the 12 months to March 2017 Table 1 below highlights that revenue is relatively even across the industry with only $1.76 per bed day separating the top and bottom quartiles.
To underscore this point for the residential segment, we can see that the Care Revenue for both the top quartile and bottom quartile is almost line ball in terms of quantum with only expenses being the differentiator.
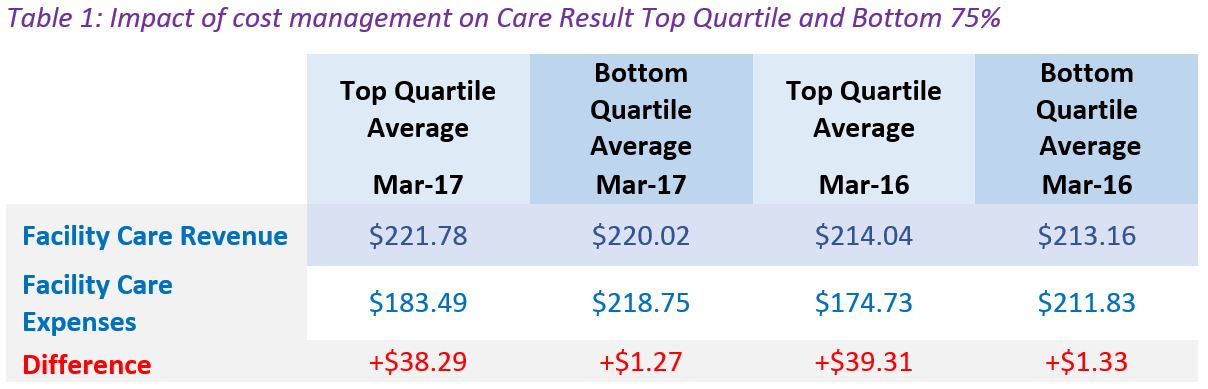
However, as the table wonderfully highlights, the top quartile performs significantly more efficiently in managing their cost base and provides the engine room for the strength of their consolidated result.
So in both Home Care and Residential Care the importance of understanding our cost drivers is critical to the sustainability of aged care businesses as a whole.
As the reform program continues we can expect that a number of possible changes will push providers to consider their approach to:
- More consumer choice in home and residential care
- Publishing their prices for care and everyday living services (residential and home care)
- A deregulated price environment to accompany price transparency
- A single funding instrument based on assessed needs (across home care and residential care)
- An independent assessor of client need and therefore funding amounts
When combined with the existing changes, the market forces inherent in the reform roadmap will require a contemporary aged care provider to be:
- Market/consumer driven
- Flexible and adaptable to a changing market
- Targeting the consumers it wishes to serve
- Productive and efficient, in both direct and indirect services
- Able and prepared to put capital to work
- Business focused; and of course,
- Will need to make a profit or surplus to be sustainable
In order to ensure providers are able to manage their controllable costs they will need to understand the cost levers within the business and how they impact on the overall result.
Although it is challenging to start it will be imperative that providers grasp the importance of knowing their units of service at a granular level. This granulated approach will allow staff and management to monitor performance and keep people accountable for the outcomes required to achieve the very necessary profit or surplus for the business.
Once attained these units of service can be combined in standard or non-standard ways to produce the services that consumers want while allowing the business to set appropriate, and in some cases premium, selling prices for the outcomes attained.
Naturally, StewartBrown encourage the use of benchmarking to drive improvements in financial and operational performance, adding another layer of accountability, insight and trend identification that will assist providers with achieving the right care mix; at the right time and at the right price for all parties.
TAGS: